Balancing Act: China's CEWC 2024 and the Tightrope Between Stimulus and Stability
In terms of absolute importance, The Central Economic Work Conference (CEWC) probably ranks third amongst all possible meetings convened by the Chinese Communist Party (CCP), being placed behind the National Party Congress (every 5 Years) and Two Sessions/Lianghui (annually in March). Yet, in terms of setting short-term, annual economic policy, the CEWC provides the clearest guidance to the CCP’s general attitude towards the current state of the Chinese economy and rough agendas for the following fiscal year.
The upcoming CEWC will be held on December 11-12, 2024, and shall have profound implications for the Chinese economy. Following anemic growth, falling consumer confidence, and housing sector troubles, the Chinese government launched a surprised stimulus package in their monthly politburo meeting on September 26th. This led to an unprecedented rally in Chinese-based equities since 2008, with the MSCI-China index rising 21.6% in 5 days, and the Hang-Seng index rising 13% since the start of the week, its largest gain since 1998.[1] Yet, following precisions on the fiscal policies of the stimulus package disappointed investors in November: the 10 trillion yuan ($1.4tn) stimulus package to restructure local government debts was deemed insufficient.[2] In summary, the POBC has been tight-lipped on specific fiscal measures, especially those meant to directly boost consumer demand, which has been seen as the most important panacea by Western economists. [3] The CEWC would thus serve as Beijing's final opportunity this year to outline its economic outlook for the remaining year.
To understand what the CEWC will bring to the table, it is important to know the CCP’s economic aims. The broad-based target is YoY GDP growth of 5% in 2024.[4] Sub-target Q2 and Q3 growth (4.7 and 4.6% respectively) was what led to the rolling of the stimulus package as sustained under-performance threatened the CCP’s annual target. [5] [6] Recent economic data for October and November on a slew of indicators have indicated a generally positive outlook, with the most promising ones being retail sales in October (increasing by 4.8%) and Manufacturing PMI in November (51.5 for small-medium sized businesses, and 50.3 for large, often State-Owned Enterprises).[7] [8] While this might indicate an initial success of China’s stimulus package, it is too tentative to say that the improvement of the economic malaise was due to actual policy. It is important to recognize external noise that might not represent fundamental effects of the stimulus package: such an analysis would be crucial for the economic experts in the CCP to make a decision by December 11th.
YoY increase in retail sales was probably bolstered by the surprise stimulus policies announced in late September following almost 2 years of sluggish economic activity after COVID, with a record number of retail investors opening brokerage accounts to ride on the stock wave.[9] It was therefore likely that the 4.8% increase in retail sales (beating expectations by 1.0%) was largely created by a one-off wealth effect. Relatively cheap goods such as household appliances (20.5%-39.2%), sports and entertainment (6.2% - 26.7%) and cosmetics (4.5%-40.1%) experienced large volume increases in sales, which was driven by the financial halo effect created by the afore-mentioned catalysts.[10] Such consumer euphoria also spilled over to large-ticket purchases as well, which are often a lot more demand-elastic. Jewelry sales decreased by 2.7%, which was a 5.1% increase from the previous month of -7.8%.[11] Car sales have increased as well, rising to 3.1% from 0.4% in September. Consumer sentiments in October therefore seem strong.
However, it is important to note that October has always been a strong month for retail growth due to China’s “Golden week holidays”, a 7-day holiday that usually marks the highest degree of economic activity, and seasonal/festive trends that include preparation of New Year/Lunar Year festivities and discretionary purchases motivated by cooler weather (home-heating appliances and clothes). [12] For example, YoY retail sales increased by a greater 7.6% in October 2023, and the average adjusted YoY retail sale percentage growth in October was 7.68% from 2015-2024.[13] A YoY increase of 4.8% thus seems much less impressive when compared to previous numbers. Additionally, whether the “financial halo” effect can persist is dependent on domestic stock market performance. The CSI 300, unlike stock exchanges in more mature and developed markets such as Europe and the US, tend to exhibit higher volatility. For example, modeled GARCH volatility of the CSI 300 from 1990 to 2024 yielded 22.96%, while this was 9.86% and 9.58% for the S&P 500 and the FTSE 100.[14] [15] [16] The strong state-interventionist nature of the CCP in the CSI 300, much like the BOJ with the Nikkei 225, can partly explain such behavior. This puts into question the sustainability of the bull rally, given that initial excitement due to stimulus measures will fade away, and long-term index performance will be dependent on organic growth and stock market returns.

Fig 1. Using widely traded ETFs for CSI 300 (ASHR) and S&P 500 (SPY) to illustrate volatility differences of the respective exchanges. Source (V-Lab. (n.d.). Realized and GARCH volatility for ASHR. NYU Stern Volatility Laboratory.)
While the Manufacturing PMI index of November saw an increase to 51.5 from October’s, substantiating data will not be published until 14th December. However, we can project historical trends from October’s economic indicators to explain the 1.0 basis point increase in November's Caixin Manufacturing PMI. The Caixin Manufacturing PMI targets small and medium-sized companies that are often more engaged with foreign markets and are therefore more reflective of the private industry’s health. October’s Caixin Manufacturing PMI was already 50.3, a 1.0 basis point increase from September’s dismal 49.3.[17] This was largely driven by a record increase in exports (12.7%) and balance of trade (largest trade surplus since June). One major influence was intense front-loading by Western customers anticipating a possible Trump victory and the resulting tariffs on Chinese exports, particularly chips, electrical components, and mass-produced consumer goods—sectors in which China holds a competitive advantage and trade surplus. This can be seen in the goods that boosted export sales the most: Integrated circuits (19.6%) and household appliances (14.5%).[18] Trump’s entry into the White House and nomination of Howard Lutnick as Commerce Secretary—“who fiercely defended Trump’s economic proposals” —likely stimulated similar front-loading activity in November.[19] [20] Ongoing tariff investigations by the EU, China’s second largest trading partner, into Chinese e-commerce retailers such as Temu and Shein and Chinese plywood were also likely to sustain bulk pre-orders in November. [21] [22]
In essence, the combined effects of front-loading in Western markets before a new onslaught of tariffs in 2025 would boost short-term exports and BOT. This is further supported by intense competition within Chinese producers: Industrial profits in October dropped by -4.3%, while industrial production growth expanded by 5.3%, in line with historical trends.[23] [24] The incessant, cutthroat production of Chinese goods—often priced below production costs—floods foreign markets, driving near-term export growth, but at the risk of long-term instability with the rise of geopolitical aligning of trade reconfigurations.[25] China’s export reorientation towards developing economies, including ASEAN, MENA, Sub-Saharan Africa, and Russia, is unlikely to immediately offset the importance of developed economies such as Japan, the EU, and the US.[26] This is primarily due to the significantly higher purchasing power and market size in the latter, which continues to drive a large share of China's exports. Therefore, it is likely that while short-term manufacturing exports will remain strong up until 2025, longer time horizons would suggest a definite deceleration in China’s export-driven manufacturing economy.

Fig 2. Trade reorientation in China with heightening geopolitical risks. Source: Seong, J., White, O., Birshan, M., Woetzel, L., Lamanna, C., Condon, J., & Devesa, T. (2024, January 17). Geopolitics and the geometry of global trade. McKinsey Global Institute
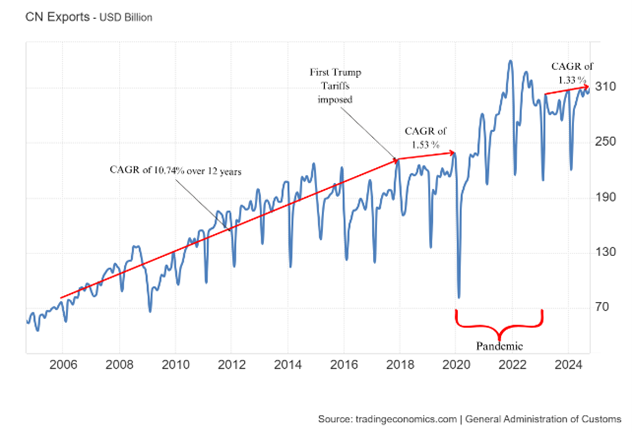
Fig 3. China’s exports before/post 2018. Will China need to find another revenue source apart from exports? Source: Trading Economics. China exports. Trading Economics.
Indicators that had an underwhelming showing included inflation rate, house price index, fixed-asset investment rate and the PMI for the tertiary sector. Inflation was a weak 0.3% increase YoY, which represented the ninth straight month of sub 1% consumer inflation and the lowest reading in 4 months, a far cry from the 2-3% before COVID. Yet, the main culprits of deflationary effects appeared on agricultural produce such as pork (- 3.7%), (-3.0%) vegetables, and (-2.0%) fruits.[27] Autumn harvest in China often peaks around October, resulting in a glut of supply in the market before demand possibly picks up soon after for end of year festivities. Therefore, slight decreases in headline inflation are not indicative of general economic health. More importantly, CPI in most key sectors such as healthcare and education picked up (apart from housing).
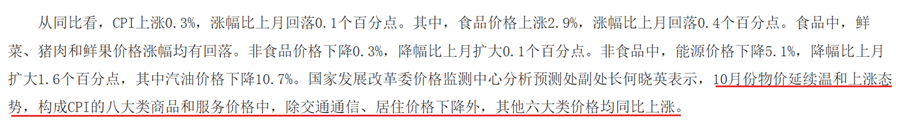
Fig 4. Increase in CPI for 6 commercial sectors: Food, Tobacco, and Alcohol; Clothing; Household Goods and Services; Healthcare; Education, Culture, and Recreation; and Other Goods and Services. Deflation was seen for transportation/telecommunication services and housing. Source: National Bureau of Statistics of China. (2024, November 10). Consumer Price Index for October 2024.
Yet, PMI in the services sector is languishing. Caixin Services PMI dropped 0.5 basis points to 51.5 in November, citing modest business growth and consecutive declines in Average Selling Prices (ASPs).[28] This apparent contradiction is revealing. Even though consumer confidence might be high, competition amongst firms has been equally fierce, essentially reducing their profits as they seek to capture an increasingly ebullient customer base. Preliminary data on e-commerce sales at the Singles’ Day Festival and another estimated increase in EV sales suggest that consumer confidence is still high. [29] [30] However, supply had outstripped demand so far that such an adjustment was still insufficient to spur greater expansion and organic growth. This probably means that domestic demand, while stimulated, is far from sufficient to reach sustainable levels in the U.S or Europe. The systemic underperformance of domestic consumption in the Chinese economy cannot be easily corrected. Additionally, the CCP seems reluctant to shift its middle to long-term high-quality focused growth narrative to policies which directly benefit domestic consumers.[31]

Fig 5. Retail sales are rather indicative of Services PMI. Trading Economics. (n.d.). Source: TRADING ECONOMICS | 20 million indicators from 196 countries.
At the same time, October’s PPI change did seem to feel the effects of the stimulus. The YoY decrease rose to -2.9% from September, while the MoM decline slowed to -0.1%, marking the second consecutive month of decrease.[32] This indicated that there have been positive signals from the stimulus, but it has not been enough to correct an entrenched lack of confidence from the producers’ perspective. From another angle, the disconnect between a warming CPI and an anemic PPI can also indicate policy time-lag. Since PPI is an index that is situated further upstream, producers’ demand for primary products depends on their opinion on short-term future customer confidence. Current indications show that while CPI has been heating up, the sluggish pace might suggest more tentative reactions for PPI. November figures for PPI are therefore likely to follow the same path of a careful increase, given that CPI seems to be buoyed by high consumer sentiment in retail and EVs.
Yet, the most important sector, and the main driver which has resulted in such economic slowdown—the housing market—does not seem out of the woods yet. The Chinese property slump is still going strong: New house price index decreased by 5.9% in October, a new record, while real estate investment decreased by 10.6% YoY during the same time period.[33] [34] The hemorrhaging of the property sector is still a pain point in the Chinese economy, which stores 74% of household wealth.[35] The ongoing stimulus measures largely target local governments—who have been overly reliant on property values as tax revenue and therefore face immense budget deficits with decreasing property prices—by allowing better debt refinancing conditions. Chinese government debt blew up from 2008 to 2024, increasing to roughly 124% of GDP, with 98% being local government debt.[36] The solution’s logic is top-down: local governments and State-Owned Enterprises (SOEs) are supposed to efficiently utilize such stimulus to reduce excess inventory, thereby motivating price recovery. However, the indirect nature of the method would mean that results will take time to show. This is in contrast with similar stimulus packages in 2008 and 2014-2016, when a larger portion of the stimulus package was targeted towards end consumers. [37]

Fig 6. Comparison of September’ stimulus package to previous iterations. Source: Moulle-Berteaux, C. (2024, November 7). China: Smoke and mirrors. Morgan Stanley Investment Management.
It is therefore likely that the housing situation in China will not see a drastic amelioration in the short-term future, despite certain positive signals: stabilizing costs of building materials such as concrete and steel after a sustained decrease in October’s PPI.[38] Goldman Sachs echoed a similar sentiment, arguing that property prices may continue dropping until late 2025.[39] However, temporary palliative measures such as the Securities, Fund, and Insurance Swap Facility (SFISF) aim to make the stock market a wealth deposit replacement to real estate, helping to mitigate the real loss in purchasing power caused by declining real estate prices.[40]

Fig 7. Chinese debt evolution. Local Governments borrowed up to 98% of GDP in 2024. Source: Moulle-Berteaux, C. (2024, November 7). China: Smoke and mirrors. Morgan Stanley Investment Management.
What we see in the stimulus and its effects is a measured, even restrained, stimulus package which did result in immediate impacts visible in most sectors of the economy, although these must be discounted once we remove external noise. However, it was clearly inadequate to provide a real “bazooka” type boost to the Chinese economy. Nonetheless, within the scope of the CEWC in 2024, it is likely that the status quo will be upheld given that the target of ~5.0% annual growth rate will be met, after better-than-expected rates of economic performance in the 4th quarter due to the stimulus. However, it is likely that underlying issues of export reductions and the consistent underperformance of the domestic economy, which is ultimately underpinned by cratering real estate prices, must be addressed with greater alacrity. The Central Economic Work Conference (CEWC) is likely to introduce progressive measures to accelerate policies aimed at stabilizing housing prices. The key word here is progressive. Allocating greater economic resources to address the immediate slowdown could reduce investment in high-quality growth sectors—a key medium-term objective for the Politburo in its pursuit of 'economic and national security.'[41] This will also be complicated by an increasingly hostile external environment and ballooning deficit levels mainly driven by excessive borrowing from local governments, leaving less margin for error for any fiscal or monetary policies. [42]
References
[1] Alim, A. N., Leng, C., Sandlund, W., & Dempsey, H. (2024, September 27). Chinese stocks post best week since 2008 after stimulus blitz. Financial Times.
[2] Feng, R. (2024, November 8). China moves to ease debt concerns—but again holds off on stimulus measures. The Wall Street Journal.
[3] Morgan Stanley estimates the amount to be roughly $1 trillion yuan, less than both $3.4 trillion yuan and $4 trillion yuan in previous fiscal policies of 2015 and 2008. Moulle-Berteaux, C. (2024, November 7). China: Smoke and mirrors. Morgan Stanley.
[4] Reuters. (2024, December 4). China can accept GDP growth of less than 5%, says People's Daily.
[5] National Bureau of Statistics of China. (2024, July 15). National economy was generally stable with steady progress in the first half year. Retrieved from https://www.stats.gov.cn/english/PressRelease/202407/t20240715_1955620.html
[6] National Bureau of Statistics of China. (2024, October 18). National economy showed stable growth trend with positive factors accumulating in the first three quarters. Retrieved from https://www.stats.gov.cn/english/PressRelease/202410/t20241018_1957042.html
[7] National Bureau of Statistics of China. (2024, November 28). In October, the total retail sales of consumer goods reached 4,479.6 billion yuan, up by 4.9 percent.
[8] Caixin Insight Group. (2024, November). Caixin China General Manufacturing PMI press release, November edition.
[9] Xinhua. (2024, October 8). Turnover hits record high on China's stock markets. China Daily.
[10] National Bureau of Statistics of China. (2024, October 18). Total retail sales of consumer goods increased by 3.2% in September 2024.
[11] Ibid
[12]State Council of the People's Republic of China. (2018, October 9). China unveils new measures to optimize business environment.
[13] National Bureau of Statistics of China. (2015-2024). China's retail sales year-on-year growth: October (2015-2024).
[14] NYU Stern Volatility Lab. (n.d.). Volatility analysis for FTSE 100 index.
[15] NYU Stern Volatility Lab. (n.d.). Volatility analysis for Shanghai Shenzhen CSI 300 Index.
[16] NYU Stern Volatility Lab. (n.d.). Volatility analysis for S&P 500 Index.
[17] Caixin Insight Group. (2024, December 2). Caixin China General Manufacturing PMI Press Release.
[18] General Administration of Customs of China. (2024, November 7). 前10个月我国货物贸易进出口增长5.2% [China's goods trade imports and exports grew by 5.2% in the first 10 months]
[19] Miao, H. (2024, November 22). American companies are stocking up to get ahead of Trump's China tariffs. The Wall Street Journal.
[20] Restuccia, A., & Schwartz, B. (2024, November 19). Trump picks Howard Lutnick as commerce secretary. The Wall Street Journal.
[21] Alim, A. N., Leng, C., Sandlund, W., & Dempsey, H. (2024, September 27). Chinese stocks post best week since 2008 after stimulus blitz. Financial Times.
[22] Bounds, A. (2024, October 10). EU plywood dumping probe opens new front in China trade dispute. Financial Times.
[23] Trading Economics. (2024, November 15). China industrial production.
[24] Trading Economics. (2024, November 27). China total industrial profits.
[25] Seong, J., White, O., Birshan, M., Woetzel, L., Lamanna, C., Condon, J., & Devesa, T. (2024, January 17). Geopolitics and the geometry of global trade. McKinsey Global Institute.
[26] Goldman Sachs. (2024, December 4). China’s economic stimulus to partially offset US tariffs in 2025.
[27] National Bureau of Statistics of China. (2024, November 10). Consumer Price Index for October 2024.
[28] Caixin Insight Group. (2024, December 4). China’s services activity expansion eases in November: Caixin PMI shows.
[29] Reuters. (2024, November 12). China's Singles' Day wraps up with e-commerce firms reporting growth in shoppers.
[30] Investors Business Daily. (2024, December 5). Tesla rival BYD, Li Auto, Nio, XPeng, Zeekr report China EV sales. Retrieved
[31] Moulle-Berteaux, C. (2024, November 7). China: Smoke and mirrors. Morgan Stanley Investment Management.
[32] National Bureau of Statistics of China. (2024, November 9). Interpretation of October 2024 CPI and PPI data.
[33] National Bureau of Statistics of China. (2024, November 15). China's new home prices fall 5.9% year-on-year in October 2024.
[34] National Bureau of Statistics of China. (2024, November 15). China's fixed-asset investment up 3.4% in January-October 2024.
[35] Zhang, X., Guo, M., Guo, R., & Zhang, Y. (2015). The analysis of household wealth in China: Composition and distribution. Public Library of Science (PLOS ONE), 10(9), e0138943. https://doi.org/10.1371/journal.pone.0138943
[36] Moulle-Berteaux, C. (2024, November 7). China: Smoke and mirrors. Morgan Stanley Investment Management.
[37] Ibid.
[38] National Bureau of Statistics of China. (2024, November 10). Producer Price Index in the industrial sector for October 2024. https://www.stats.gov.cn/english/PressRelease/
[39] Goldman Sachs. (2024, November 11). Has China’s property market reached the bottom?
[40] Pepperstone. (2024, November 1). China’s stimulus boost: Policy focus and stock market outlook.
[41] Central Committee of the Chinese Communist Party. (2020). Proposal of the Central Committee of the Chinese Communist Party on Drawing Up the 14th Five-Year Plan for National Economic and Social Development and Long-Range Objectives for 2030. Xinhua News Agency.
[42] Moulle-Berteaux, C. (2024, November 7). China: Smoke and mirrors. Morgan Stanley Investment Management.